How do I read stock market charts? This question often comes to the lips of beginners. People who have just started their adventure with cryptocurrencies often have trouble understanding what is happening in the chart and consequently what consequences it can have for the speed and profitability of their investments. In this text, we will focus on presenting how to effectively start reading data from charts.
How do I read charts?
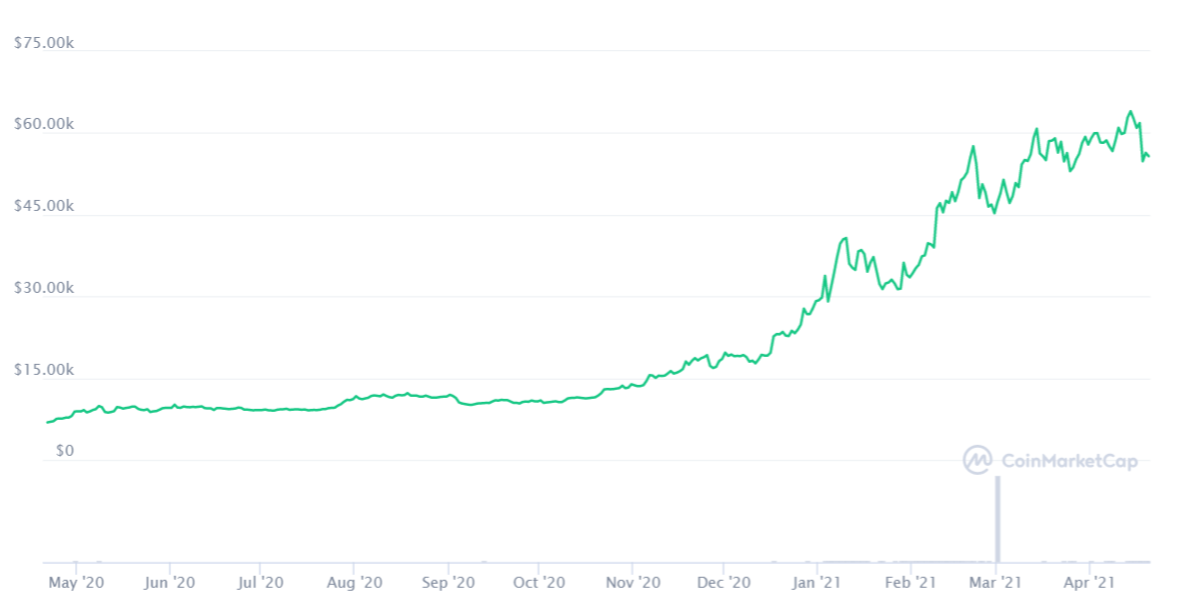
There are several different types of charts in the investment markets. The simplest and most common is the line price chart – shown in the image below. It is perfect for showing the average price for a long time. Such a graph is found, for example, in cryptocurrency data aggregators – Coinmarketcap, Coinpaprika.
Candlestick chart
Reading the meaning of candlestick is definitely a bigger challenge. The construction of such diagrams differs from the linear ones. Candlestick charts date back to 18th century Japan. Their author was a man named Homma. He found that although there is a connection between price and demand and supply in the rice market, the emotions of traders also play a role.
Light shows these emotions by visually representing the price movements of different clones. Traders use candlestick patterns to make investment decisions based on repetitive patterns that help predict short-term price movements.
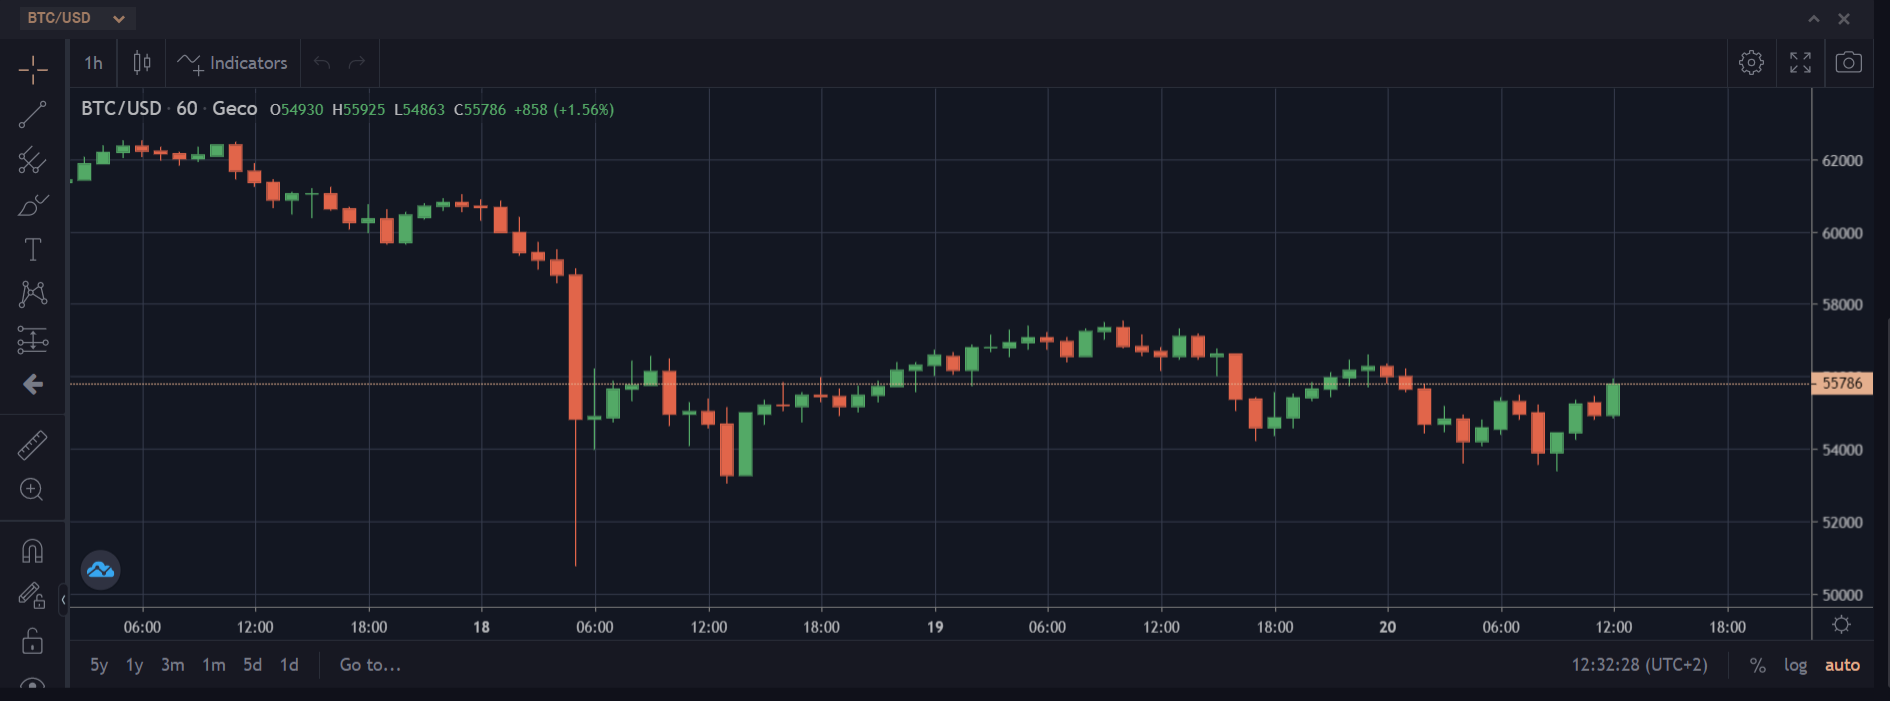
Candlestick chart on the Geco.one platform
Components of a candlestick diagram
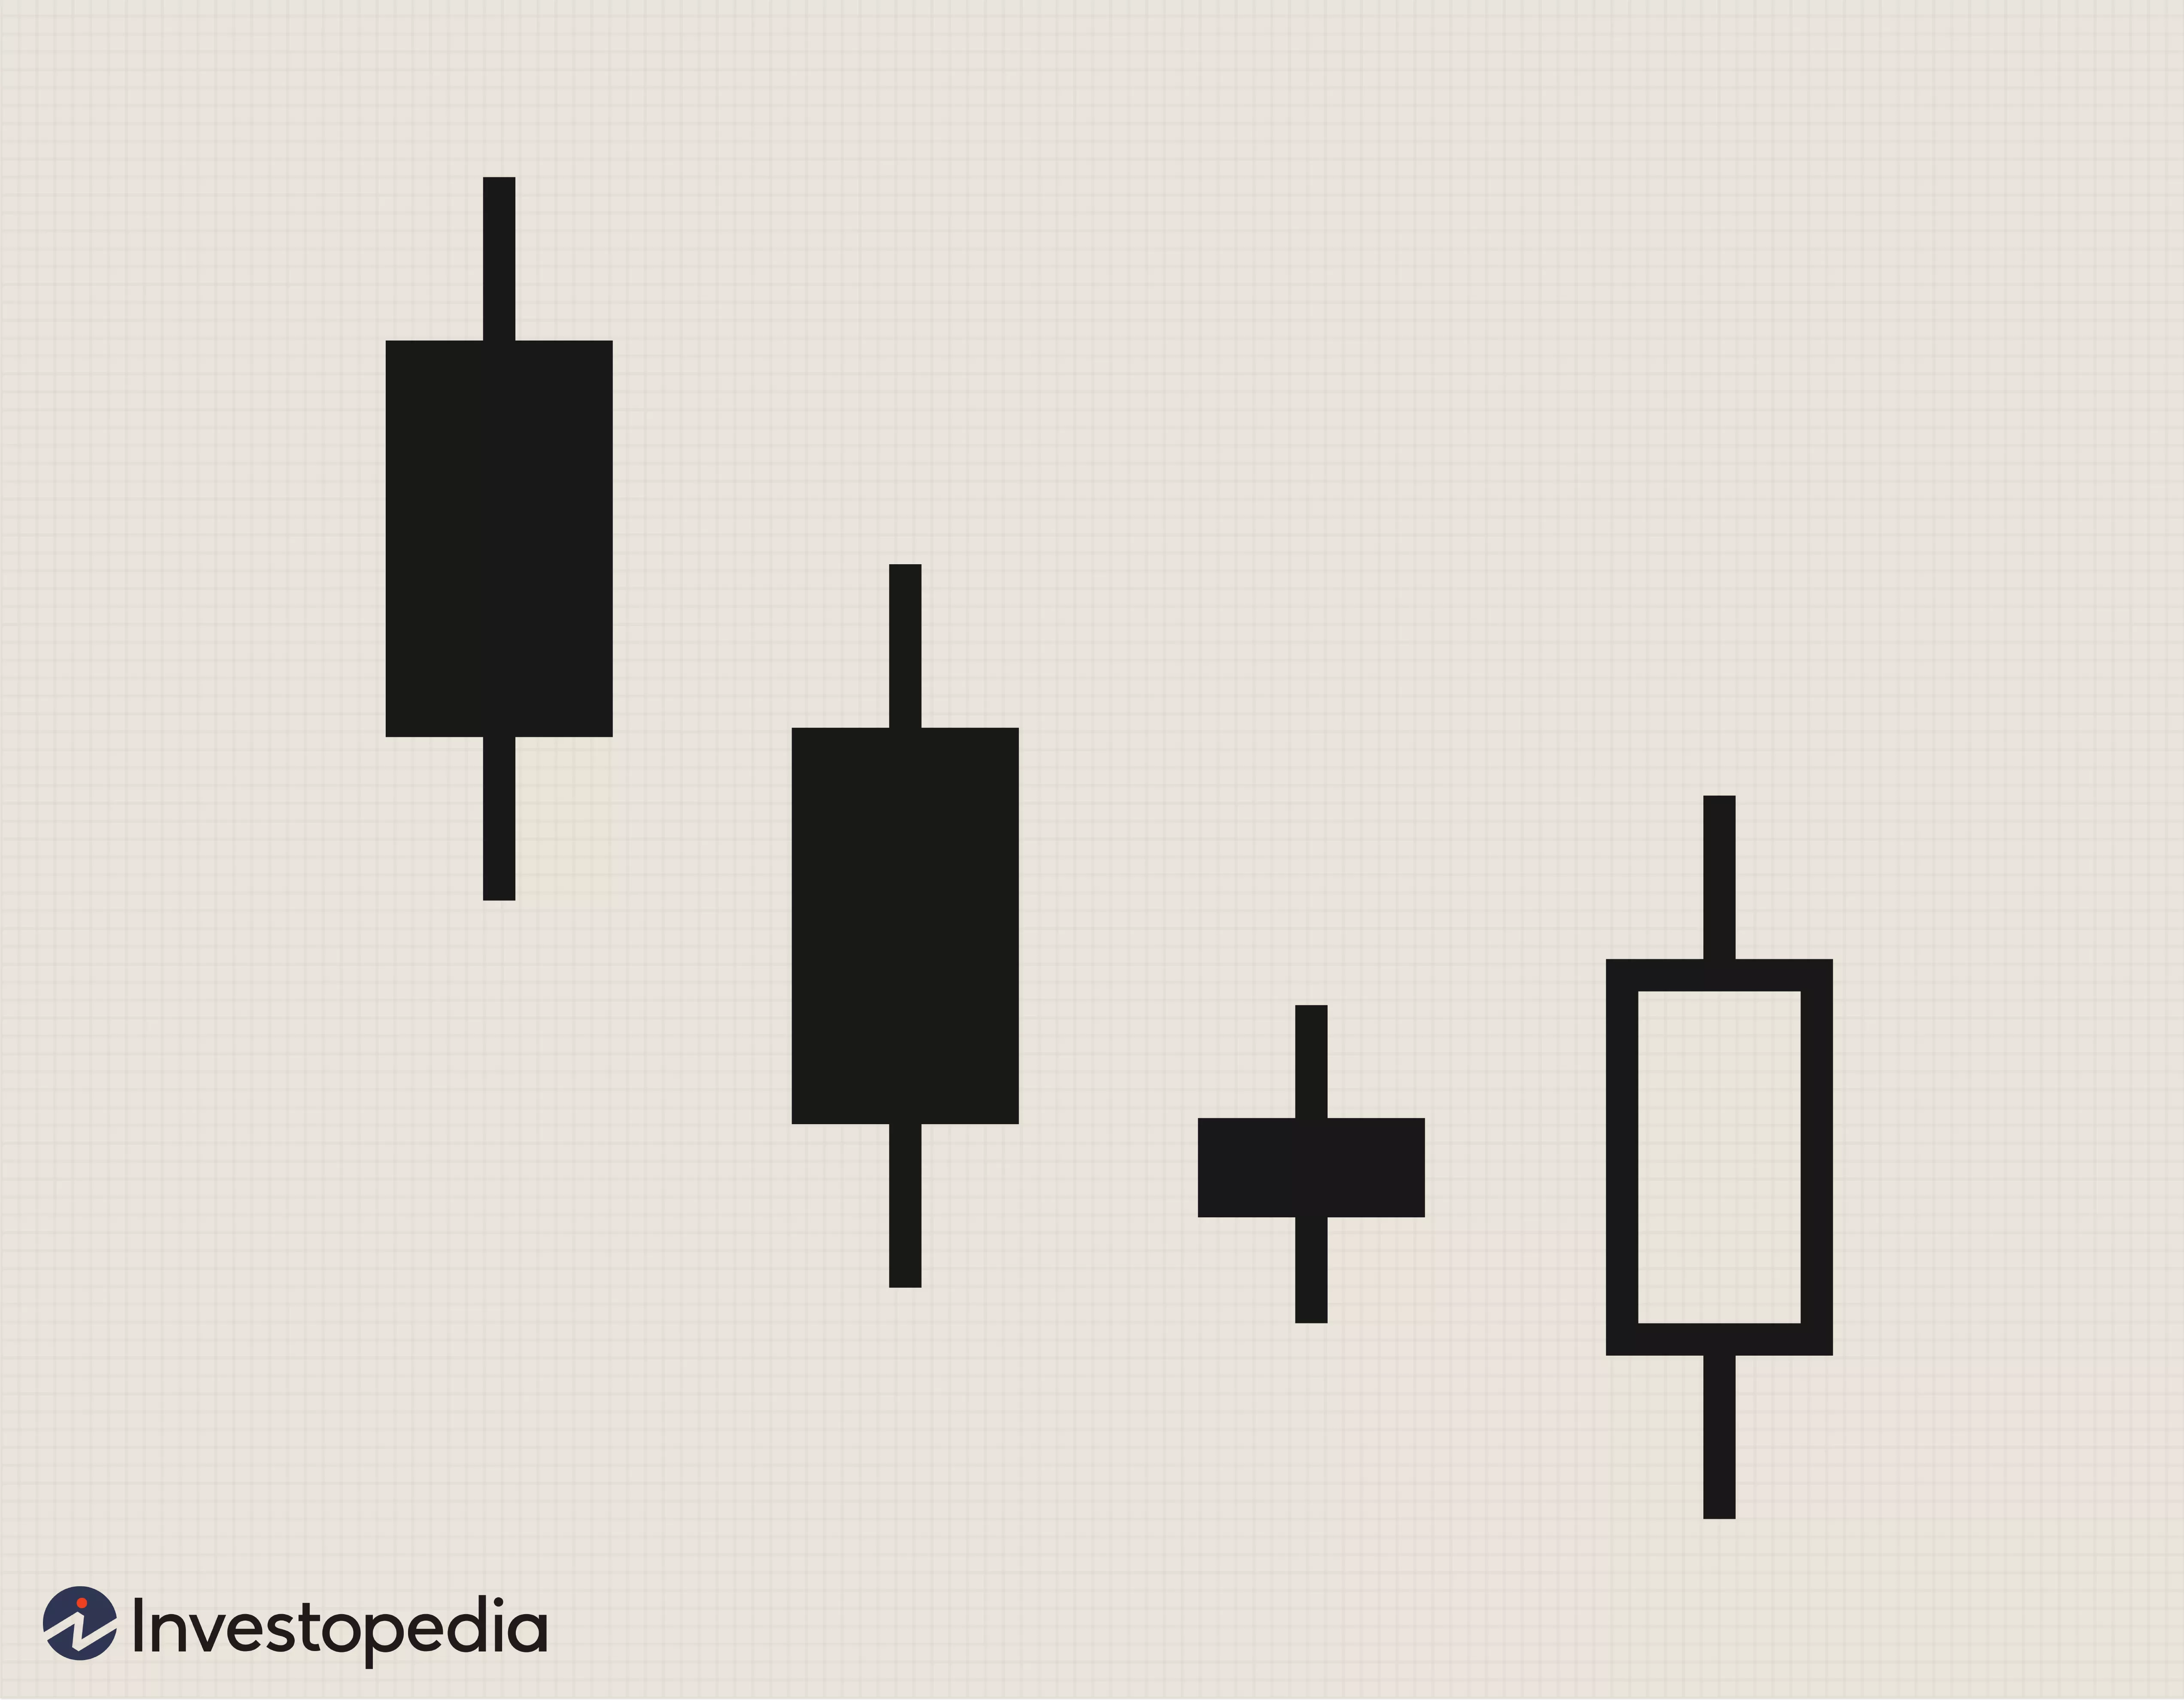
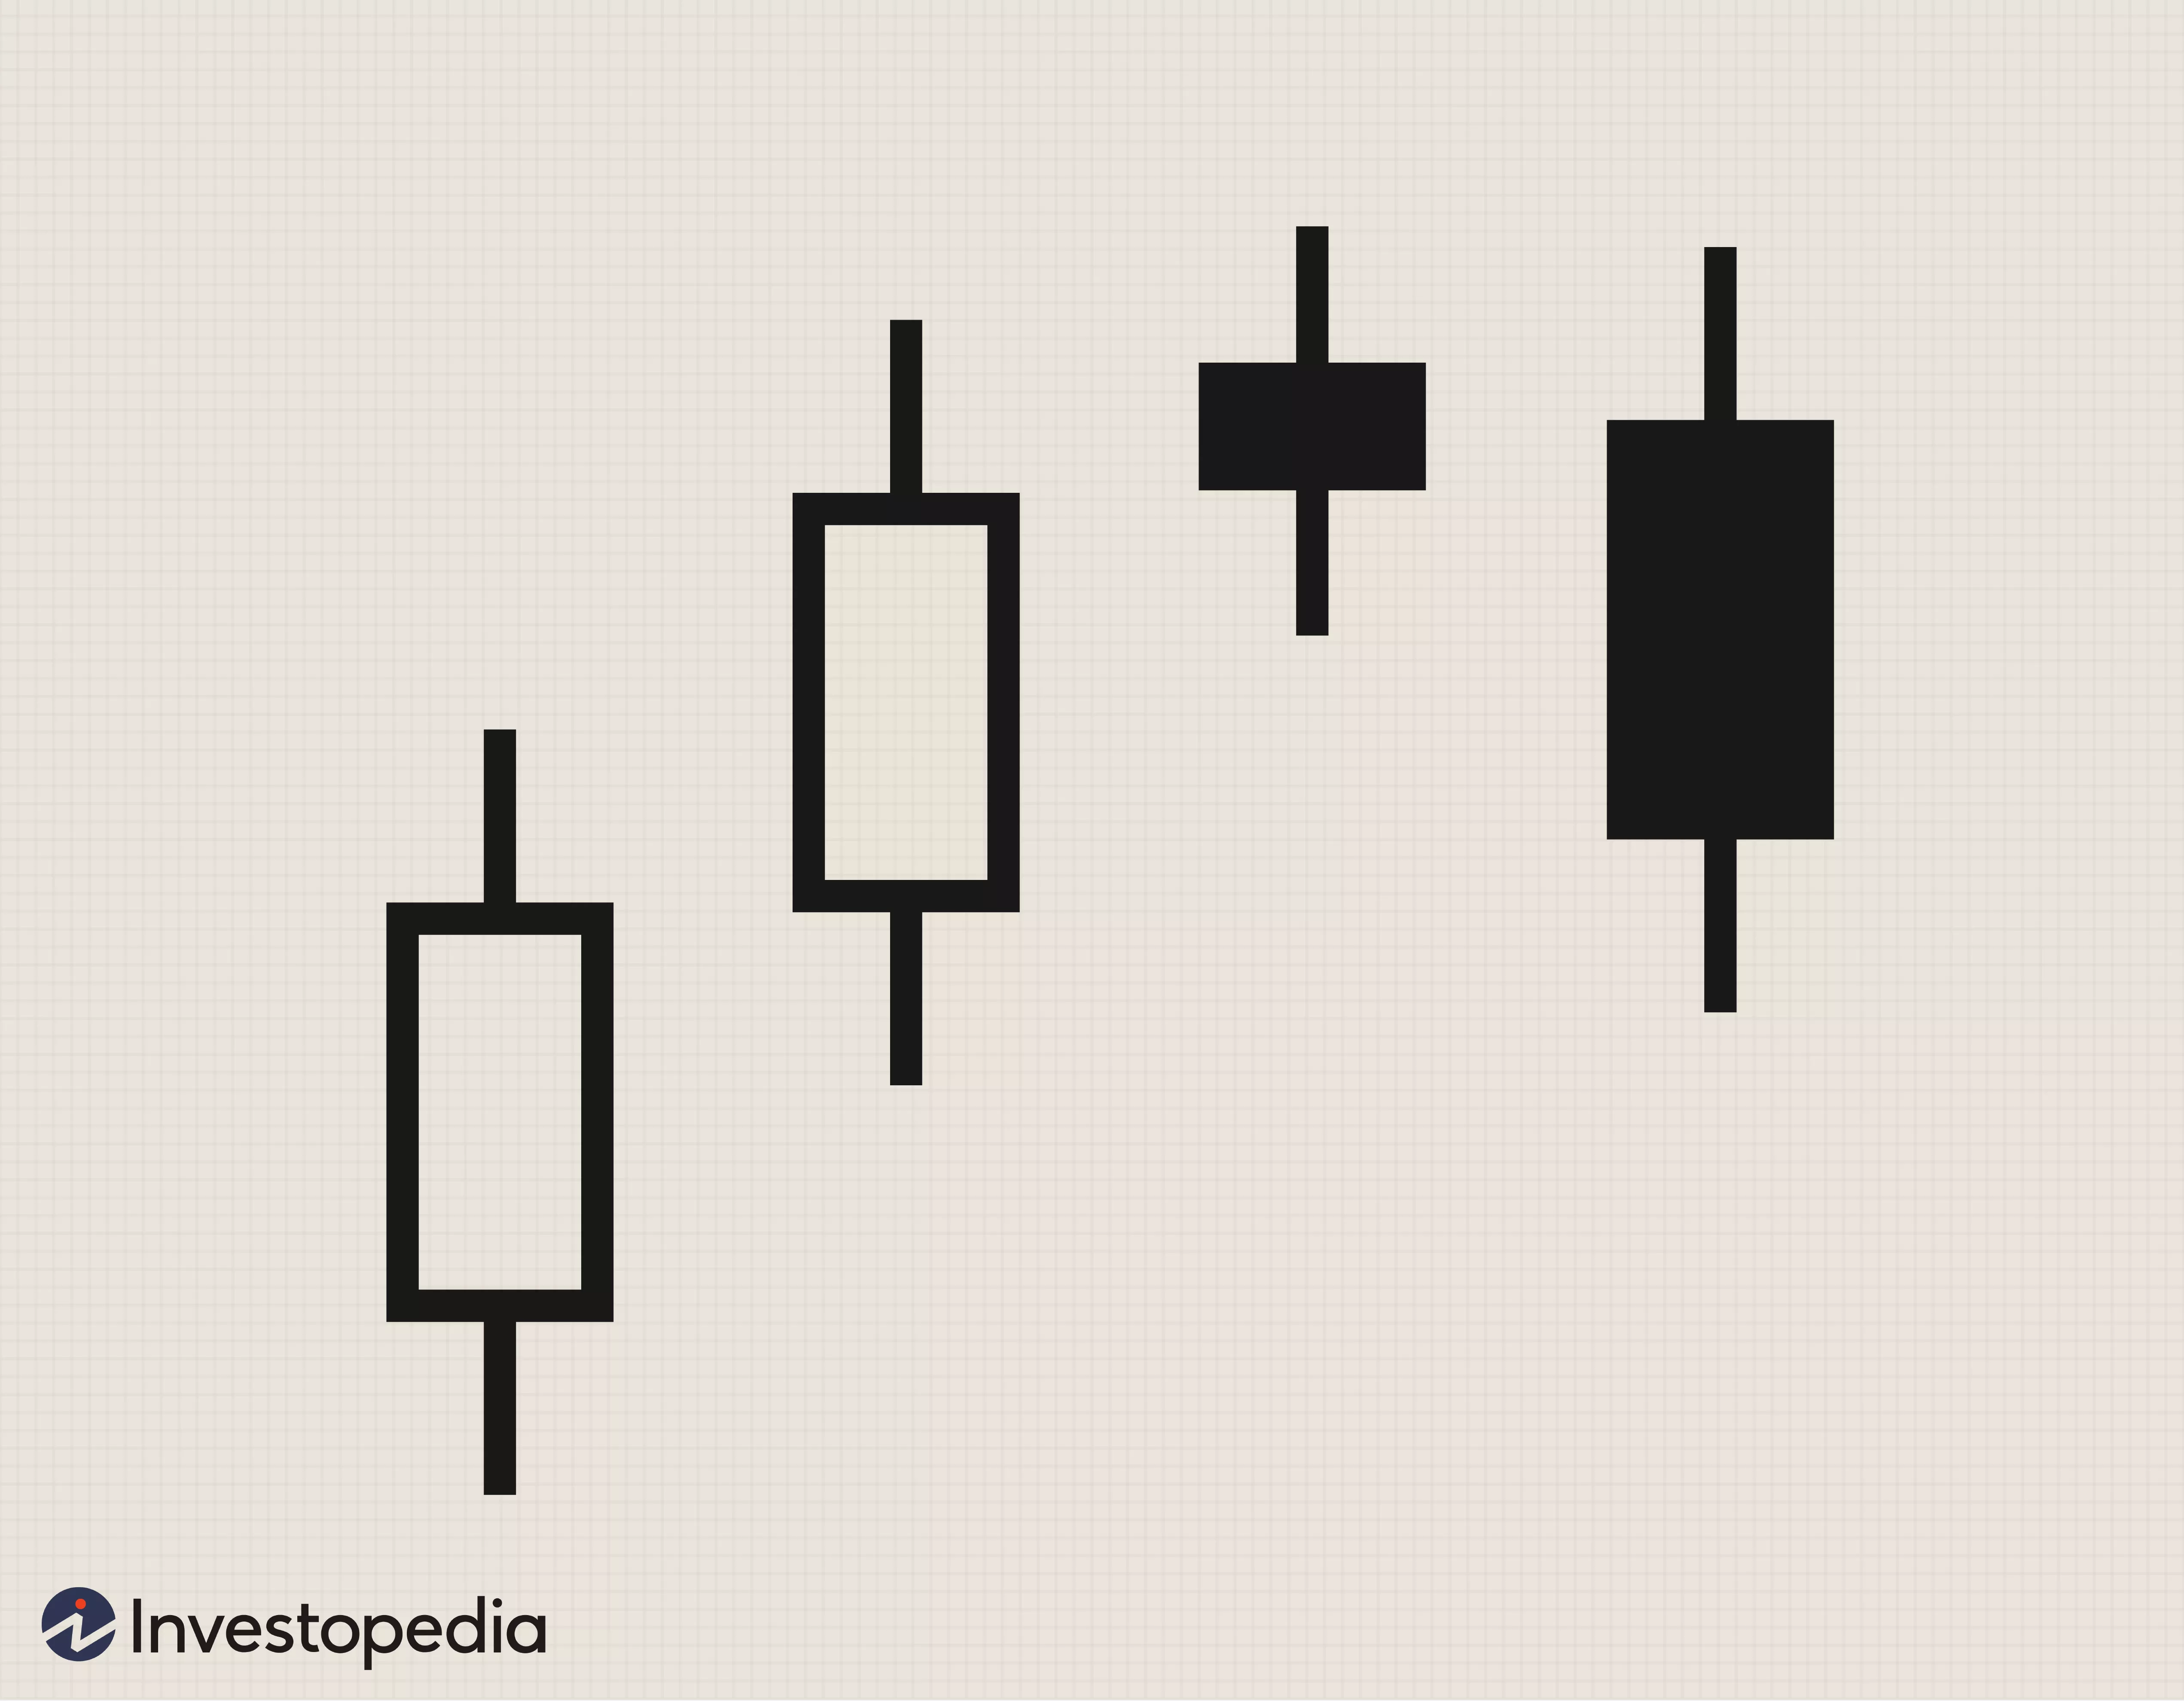
The candlestick chart gives us some information about the current market situation. Traditionally, this is information about the opening and closing price of a session, as well as the highest and lowest prices during a certain period. The light itself is divided into two parts, wide – also called the body and vertical stripes – called shadows.
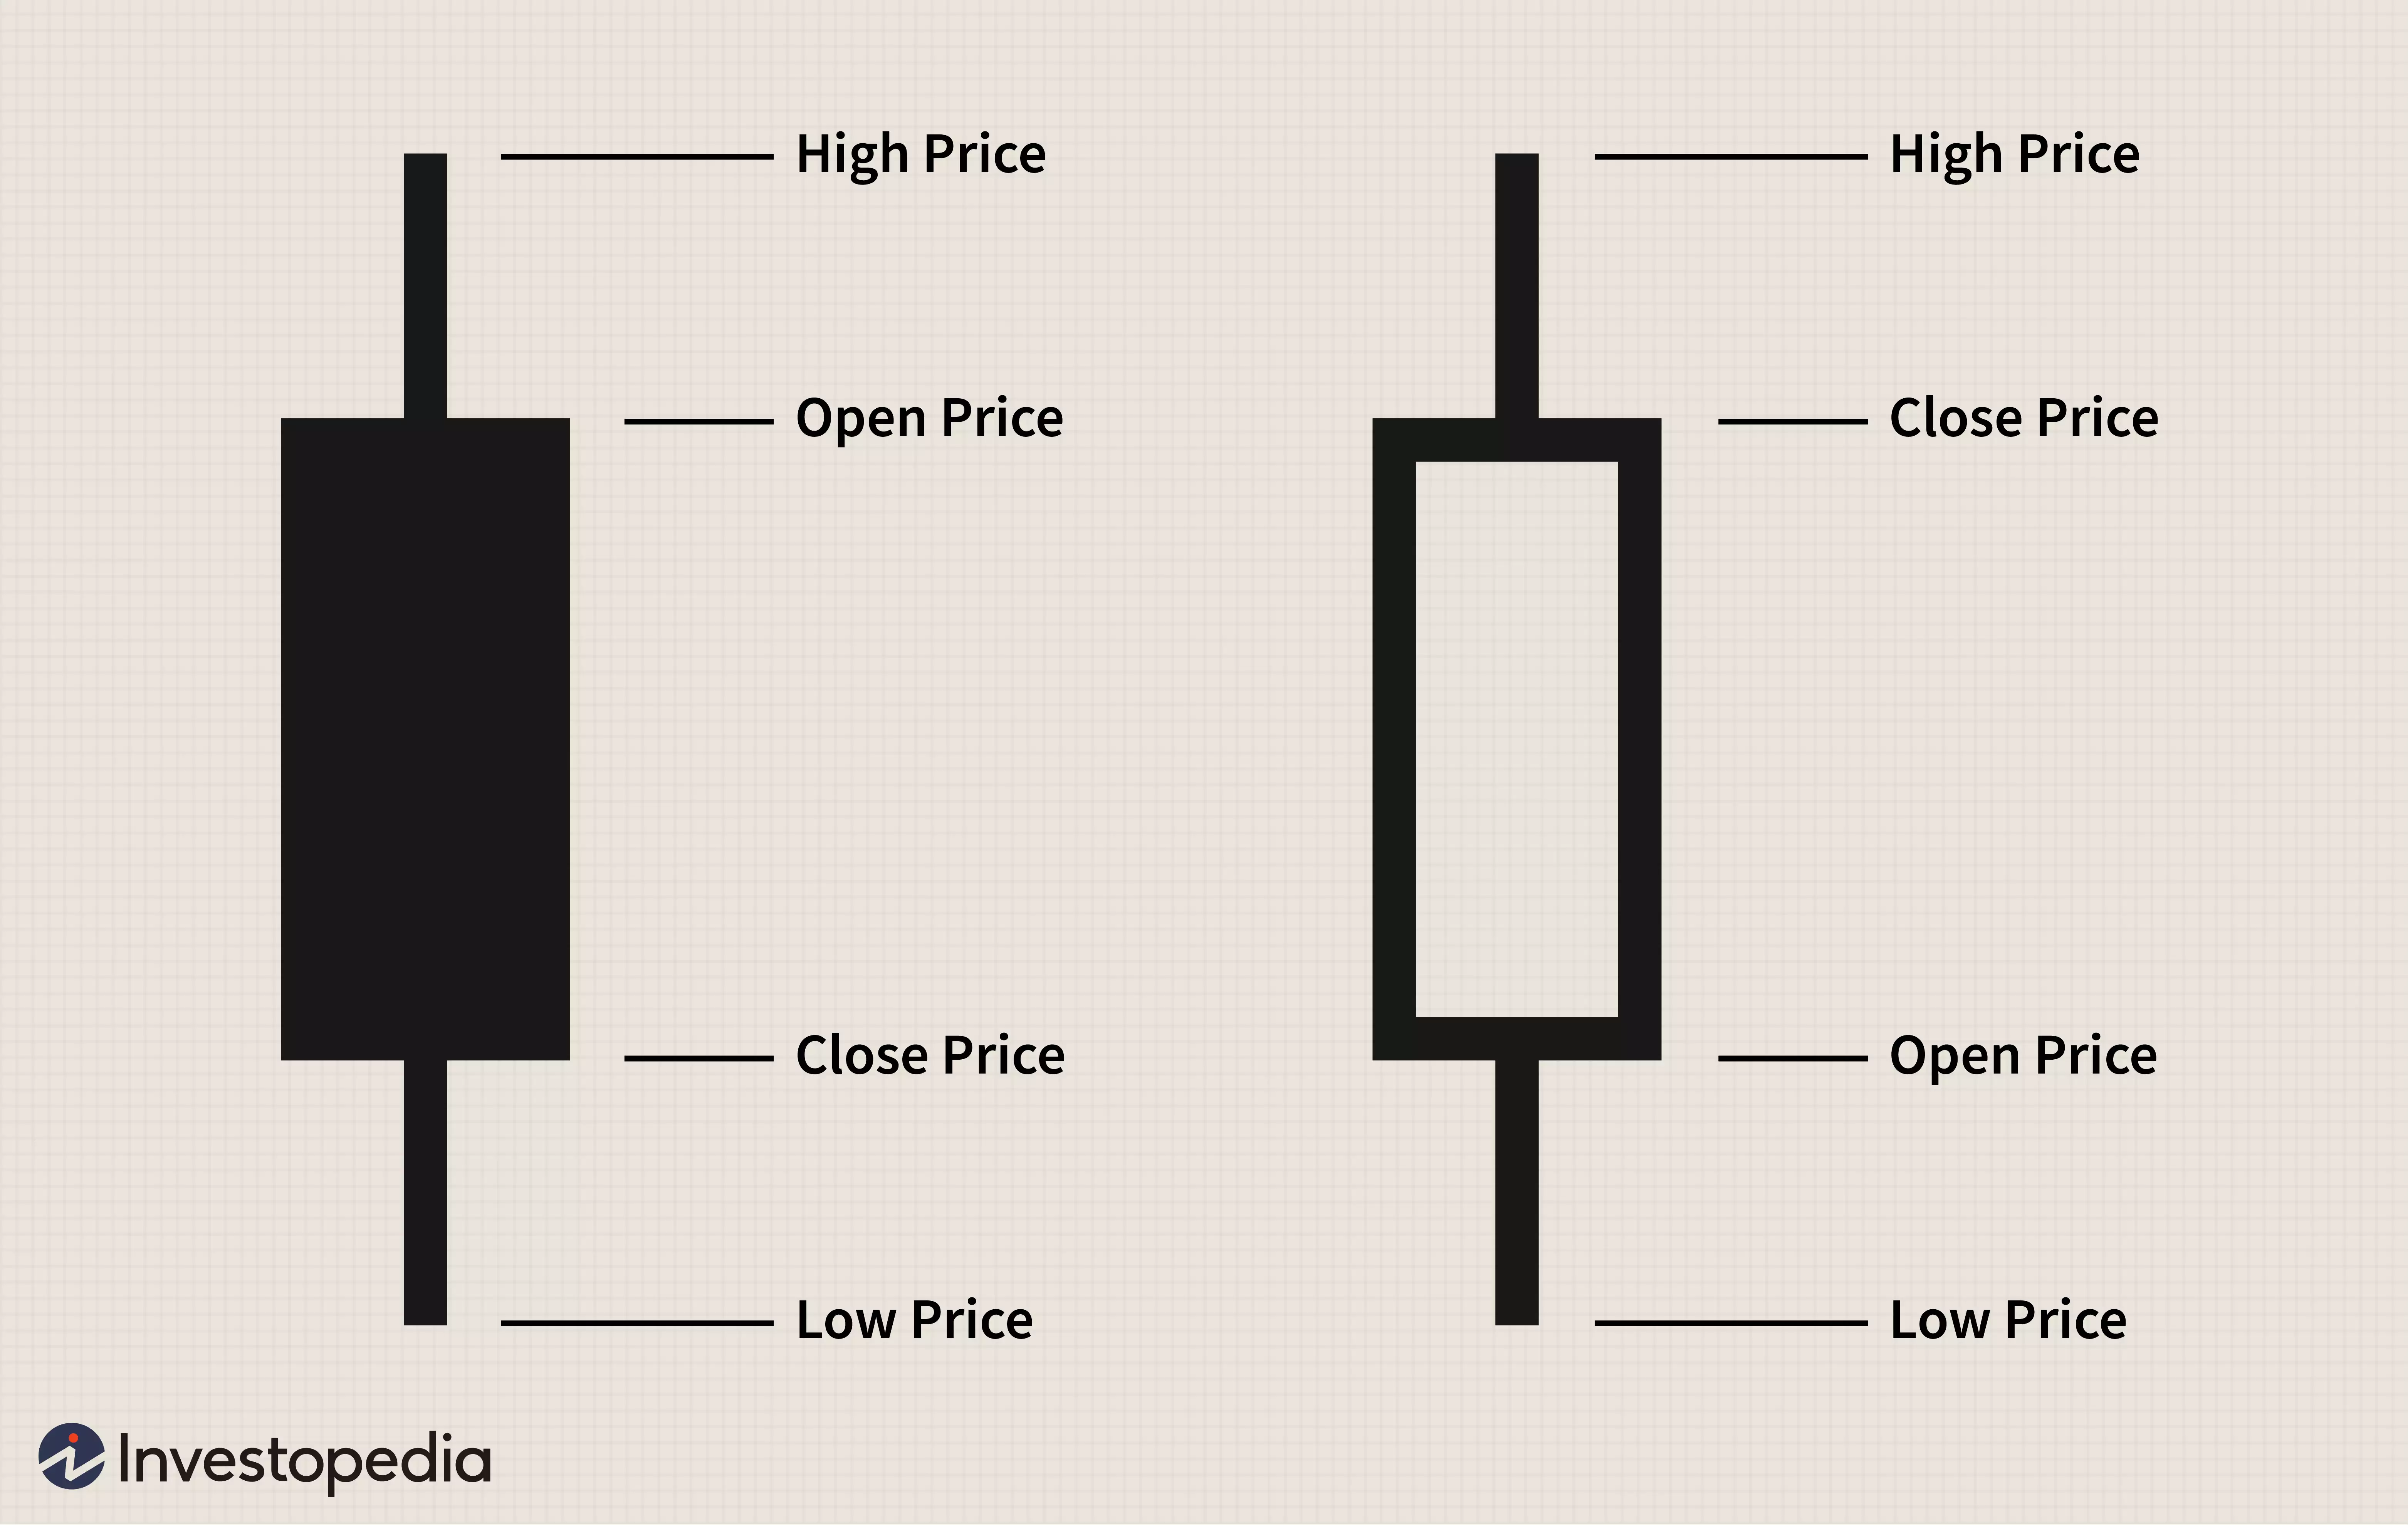
Corpus represents the price difference between the opening / closing price (session or period). When the body is filled with black, it means that the closing price was lower than the opening price. On the other hand, when the body remains empty, it means that the closing price exceeds the opening price. On stock exchanges and trading platforms, candles often have a different color – candles are red and empty candles are green.
The shadows, on the other hand, show maximum and minimum values traded during the session / period.
The short top shadow in the bullish candlestick indicates that the closing price of the session was close to the highest of the day (during this period). The relationship between the body and the shadow elements directly affects the final shape and color of the light.
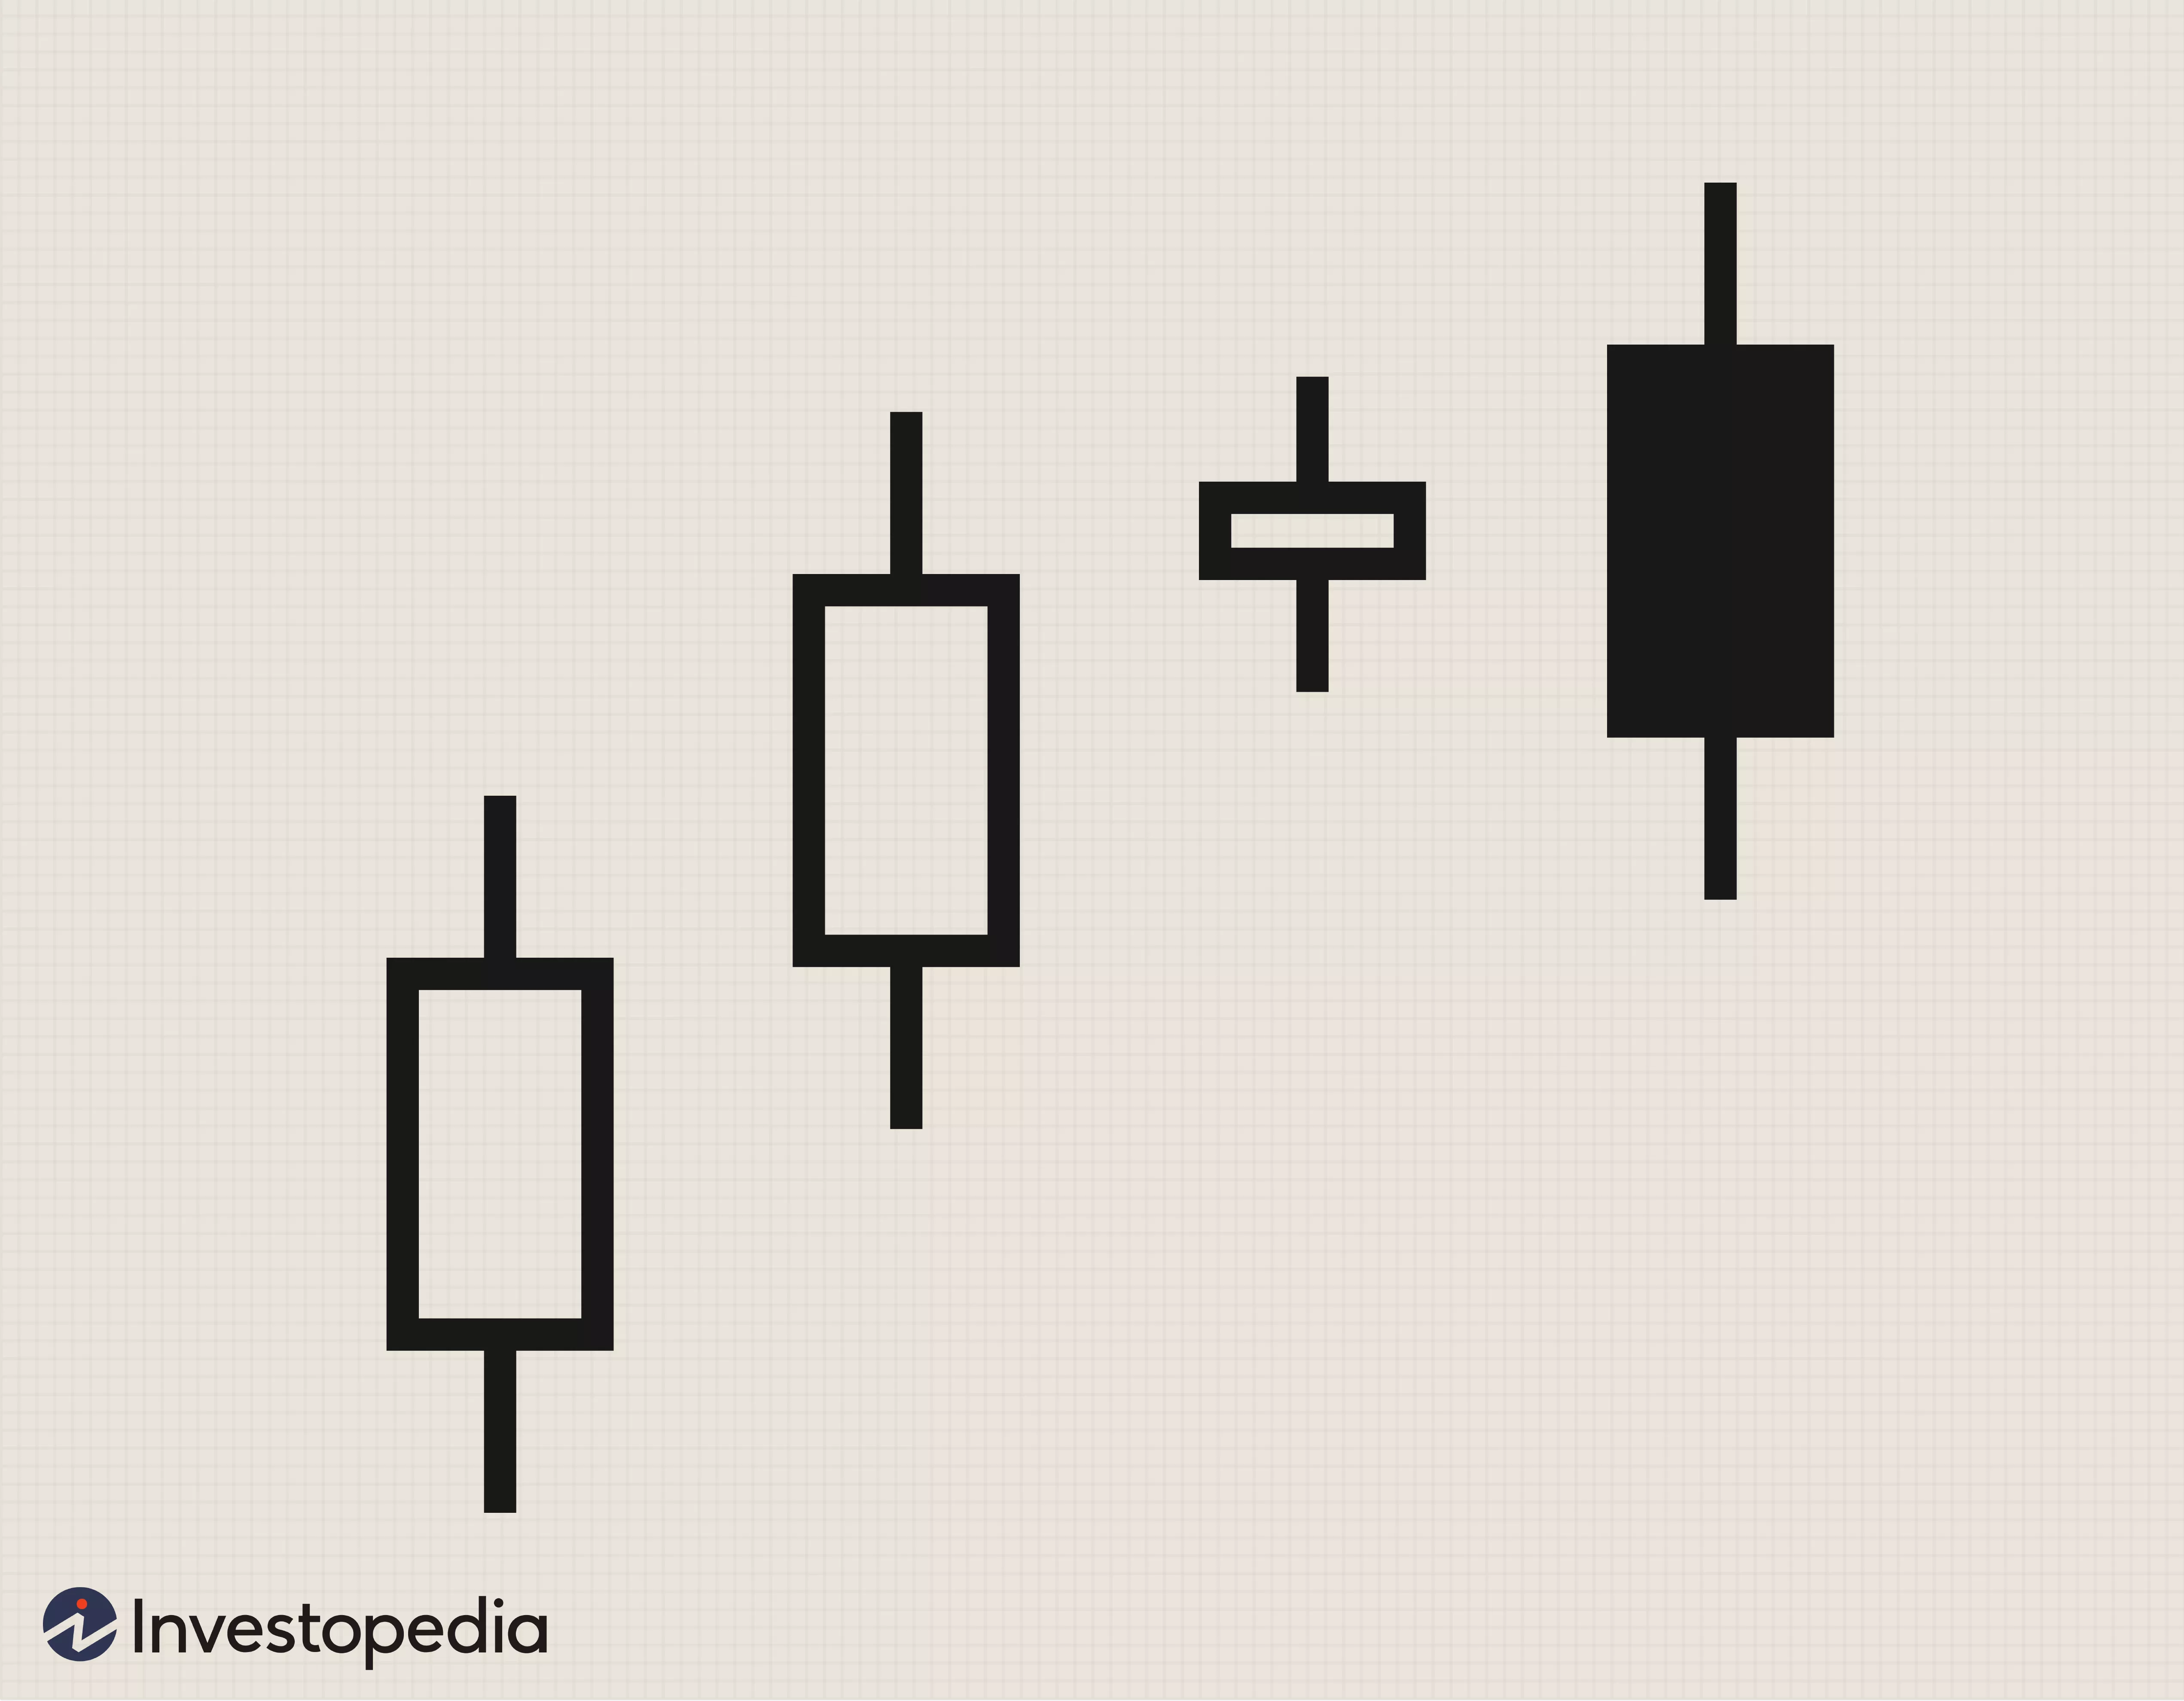
Example of a pattern in a candlestick diagram
As mentioned above, individual candles form sequences that traders use to predict future price movements in the market. Below you present some basic candlestick formations. Remember, however, that this tool only serves as an aid in technical analysis – it does not provide 100% certainty when making an investment decision.
Bearish swelling pattern
Bearish Engulfing Patter occurs during an upward trend when sellers outperform buyers. This pattern is reflected in the red long-body light that swallows the smaller, green. This pattern usually indicates that sellers have taken control of the market and the price will continue to fall.
Hossy Engagement – Bullish Engulfing Pattern
The house-safe takeover pattern occurs when buyers outweigh sellers. It is formed by the formation of a long green light that encloses a short red light. Such a bullish pattern could be a signal of further price increases for a particular asset.
Bearish Evening Star
The evening star is the top pattern. Occurs when the last light in the sequence is below the body of the previously short light. The last candle has the same length as two periods before. The pattern shows sellers control over buyers and may indicate a decline in behavior.
How do I read charts? Effective
The examples presented are just the top of the gigantic number of patterns found on the candlestick. Knowing them can help you build short-term investment strategies. However, it is worth remembering that knowledge of diagrams should also be supported by other elements. Earlier we mentioned the use of the RSI indicator, and if you do not feel sufficient to invest yourself as a trader – you can always use the option to create a PAMM account.


